Data Center Power Monitoring: Unused Capacity Does Not Mean Available Capacity

Data center power monitoring shows the available capacity at each point in the infrastructure and helps identify where additional growth is still possible.

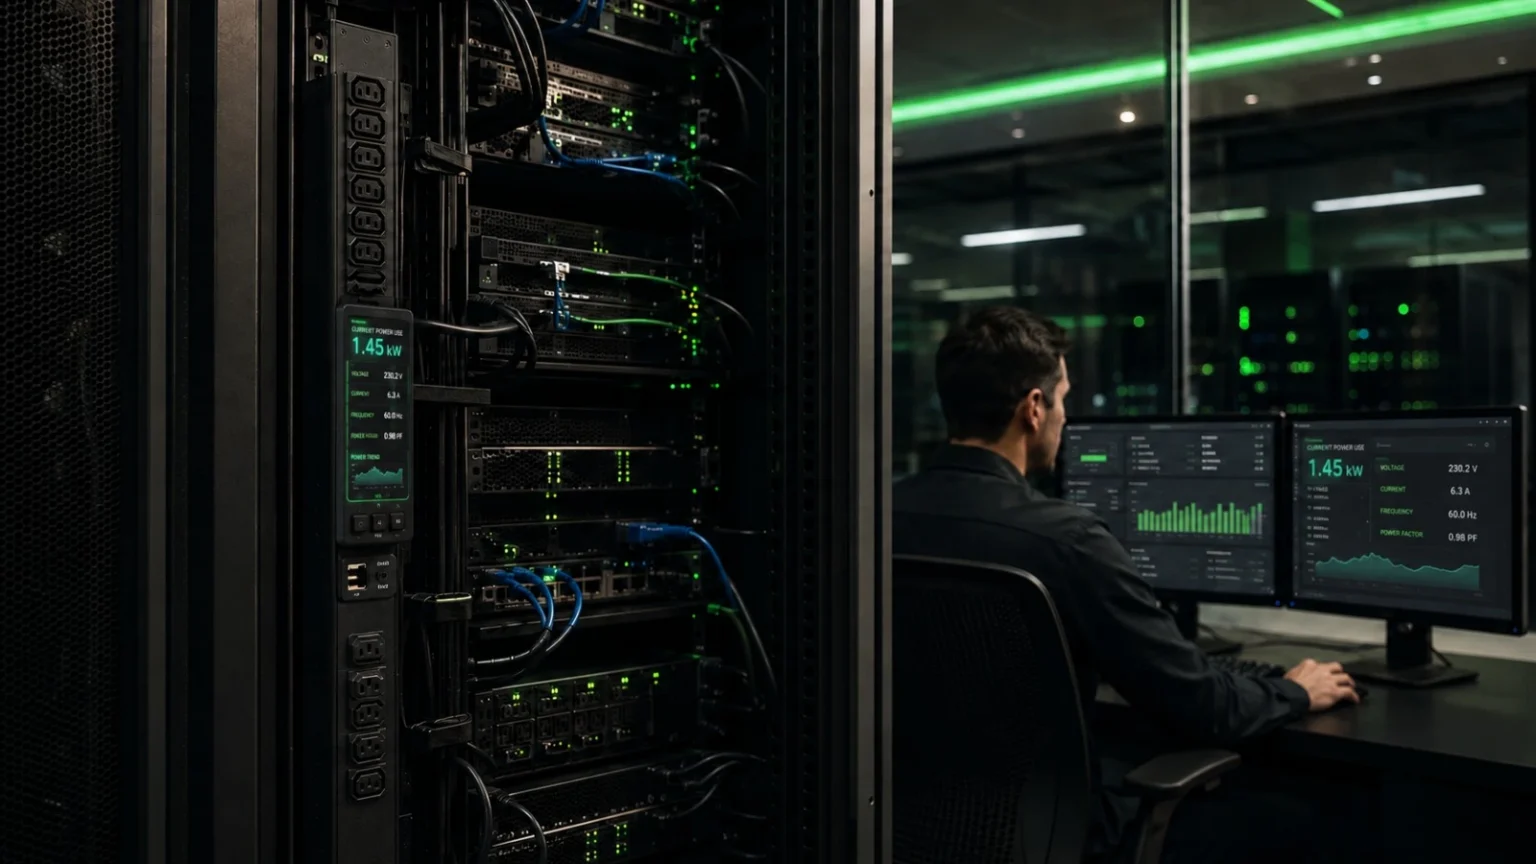
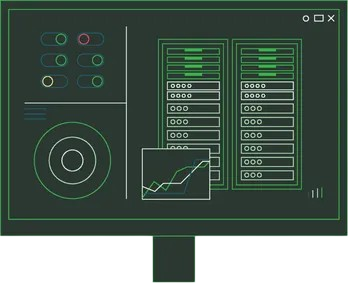
Data center power monitoring showing energy consumption and mission-critical rack infrastructure.

Measuring power consumption is only the beginning. The value of data center power monitoring lies in contextualizing each data point by linking it to the rack, phase, circuit, connected equipment, and capacity limits of each component. This correlation supports safe, informed decisions. Without it, operations teams see only averages, while the areas of greatest risk remain hidden.

Although the data center’s total capacity may indicate room for growth, that capacity is not always available at the specific rack, phase, or circuit where a new load must be connected. Consistent capacity planning requires more than knowing how much power the data center consumes. It is essential to understand how the load is distributed and the operational limits of each component in the electrical infrastructure.

For example, a rack with more available physical space may appear to be the best option for new equipment while still being close to the electrical limit on one of its phases. By contrast, another rack with less available space may have a more balanced load distribution and provide greater capacity for expansion.

Two racks in the same aisle:

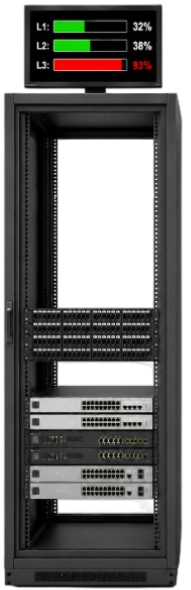
Rack A: 38% physical occupancy. It appears to be the best option for expansion, but phase L3 is operating at 93%. Expansion is blocked.

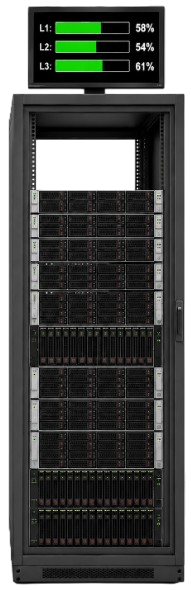
Rack B: 78% physical occupancy. It appears full, but its phases are balanced. Capacity is still available.

Rack A​

38%

Occupancy

Appears to be the best rack for expansion

But it is constrained
L3 at 93%

Expansion blocked

Rack de data center com 38% de ocupação e limitação elétrica identificada pelo monitoramento elétrico

Free space does not mean available capacity.

Rack de data center com 78% de ocupação e margem elétrica disponível identificada pelo monitoramento

Rack B

78%

Occupancy

Appears to have less room for expansion

Still has capacity headroom
Balanced phases

Capacity available

Appearances can be misleading. Free rack space does not mean available electrical capacity. Load limits, phase imbalances, and infrastructure constraints can reduce the capacity that can actually be used. This distinction determines where to install new loads, when to redistribute equipment, and how much expansion the site can truly support.

Data center power monitoring shows where capacity headroom actually exists. By comparing measured capacity with the limits at each point, operations teams can identify which racks can still support new loads, where constraints exist, and when equipment redistribution should be considered. This prevents physical space and electrical capacity from being treated as equivalent.

Three Concepts Data Center Operations Often Confuse

Installed capacity: what the infrastructure was designed to support at that point.

Observed capacity: what the meters currently record at that point.

Available capacity: the difference between the two, while accounting for phase, circuit, and rack limits.

Physical occupancy is a separate metric. It indicates how much of the available rack unit space is occupied. It is useful for logistics, but not for making load placement decisions.

A rack can have half of its rack units empty and no electrical capacity headroom.
The opposite can also occur.

Why Total Data Center Power Consumption Is Not Enough

Aggregate consumption answers one question: how much power does the site consume? It does not answer the question that matters for expansion: where can additional load still be installed?

Total consumption may appear to be well within capacity while a circuit, a phase, or a specific rack is operating at its limit. The data center’s apparent capacity is not the capacity available at the point where the next load will be connected.

Averages hide this distinction. According to the Uptime Institute Global Data Center Survey 2025, the average modal rack density across the sample reached nearly 9 kW per rack. Excluding high-density facilities, it falls to 7.5 kW. Within the same data center, racks with available headroom and saturated racks can coexist, and a single average metric cannot distinguish between them.

View

What It Shows

Question It Answers

Aggregate

Consolidated site-level consumption

How much power does the data center consume?

Localized

Load distribution by measurement point

Where is power consumption concentrated?

Aggregate

What It Shows Consolidated site-level consumption

Question It Answers How much power does the data center consume?

Localized

What It Shows Load distribution by measurement point

Question It Answers Where is power consumption concentrated?

Both perspectives are necessary. Only the second shows where the next load can be added.

Where to Measure: From the Facility Service Entrance to the Outlet

Power monitoring can track energy use across five levels. Monitoring power at different points provides insight into everything from overall consumption to the behavior of specific loads.

Level

What It Reveals

Facility service entrance

Total consumption, demand, and overall power profile

UPS systems and electrical panels

Loading on core infrastructure

Circuits and phases

Branch Circuit Monitoring, available headroom, and phase imbalance

Rack

Power consumption close to IT equipment

Outlet or asset

Behavior of specific loads

Facility service entrance

What It Reveals

Total consumption, demand, and overall power profile

UPS systems and electrical panels

What It Reveals

Loading on core infrastructure

Circuits and phases

What It Reveals

Branch Circuit Monitoring, available headroom, and phase imbalance

Rack

What It Reveals

Power consumption close to IT equipment

Outlet or asset

What It Reveals

Behavior of specific loads

No level replaces the others. The appropriate choice depends on the decision being made.

To monitor the site as a whole, aggregate measurement is sufficient. To determine where to install new equipment, redistribute loads, or expand, measurements must be taken close to the point where the load will be connected.

Intelligent Rack PDU: Measurement at the Point of Load

In data center power monitoring, an Intelligent Rack PDU measures power where it is consumed: at the rack, by phase, by circuit, and, depending on the model, by outlet.

When Is Outlet-Level Measurement More Useful Than Aggregate Rack-Level Measurement?

Aggregate measurement shows how much power the rack draws as a whole. Outlet-level measurement makes it possible to identify which specific loads contribute to that consumption when this capability is available on the Intelligent Rack PDU being used.

It is useful when operations teams need to associate power consumption with specific equipment, investigate differences between loads, or locate changes in electrical behavior more precisely.

It is the difference between knowing that the site’s load increased by 40 kW and knowing in which racks, phases, circuits, or loads that increase occurred.

Not every PDU provides the same capabilities. Granularity, protocols, alarms, outlet control, and integration capabilities vary by manufacturer and product line. These criteria must be defined before purchase based on the decisions that data center operations need to support.

What an Isolated Electrical Data Point Does Not Reveal

A single reading shows current, voltage, power, or energy consumption at a specific point, but it does not reveal the operational impact on its own.

Information

What It Shows

Context Required for Decision-Making

Total consumption

Energy used

Distribution across areas, circuits, and racks

Current on a phase

Load on the conductor

Applicable limit, phase balance, and connected assets

Power at a rack

Demand at that point

Installed equipment, available headroom, and historical data

Electrical alarm

Proximity to a limit

Affected assets, location, and recurrence

Total consumption

What It Shows

Energy used

Context Required for Decision-Making

Distribution across areas, circuits, and racks

Current on a phase

What It Shows

Load on the conductor

Context Required for Decision-Making

Applicable limit, phase balance, and connected assets

Power at a rack

What It Shows

Demand at that point

Context Required for Decision-Making

Installed equipment, available headroom, and historical data

Electrical alarm

What It Shows

Proximity to a limit

Context Required for Decision-Making

Affected assets, location, and recurrence

Knowing that power consumption has increased does not show where the increase occurred, which assets are involved, or how much capacity headroom remains.

The number is accurate. Even so, it does not support a decision on its own.

A measurement shows the condition. Context reveals the impact.

Installed Capacity ≠ Available Capacity: The Stranded Power Problem

According to Uptime Intelligence (December 2025), data centers lose 10% or more of their UPS capacity to stranded power. This capacity exists within the infrastructure, but the IT load cannot use it because of how the load is distributed.

Not all of this capacity can be recovered through monitoring. But without localized monitoring, it cannot even be identified.

When measurements are organized within DCIM, operations teams can compare measured capacity with the limit at each point and determine whether the headroom shown on the overall dashboard is actually available at the rack, phase, and circuit where the new load will be connected.

The result depends on three factors: measurement quality, the consistency of asset records, and the criteria used to represent capacity.

Accurate measurements combined with poor records lead to confident but incorrect decisions.

Installed Capacity Does Not Mean Available Capacity

Actual headroom depends on the point where the decision is made, load distribution, and the applicable limits.

Capacidade instalada da infraestrutura no monitoramento elétrico de data center

Installed Capacity

Capacity designed for or provided by the infrastructure.

Capacidade observada no monitoramento de energia em data center a partir da demanda registrada

Observed Capacity

Demand recorded at monitored points.

Capacidade disponível identificada por meio do monitoramento granular de energia no data center.

Available Capacity

Headroom that can actually be used at the point where the decision is made.

Rack PDU Measures. DCIM Provides Context.

The integration between Intelligent Rack PDUs and DCIM serves one essential purpose: it links each measurement to the point where it was collected, as well as to the assets, limits, and capacity associated with that point.

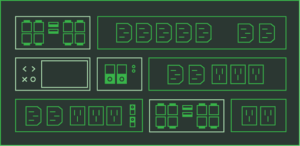
Rack PDU para monitoramento elétrico de data center com acompanhamento do consumo, carga por fase e capacidade

• power consumption by rack and outlet

• load by phase

• capacity headroom

• overload alerts

Rack-Level Visibility

Integração entre Rack PDU e DCIM para monitoramento elétrico de data center
DCIM para monitoramento elétrico de data center com análise da infraestrutura elétrica, clima, capacidade e ativos

• electrical infrastructure

• environmental conditions

• installed capacity

• asset management

Operational Context

When power monitoring is placed in context, data center operations can:

identify load imbalances

recognize capacity saturation trends

reduce the likelihood of overload

support capacity planning

What Changes When Data Center Power Monitoring Gains Context?

Stage

Objective

What Changes in Data Center Operations

Visibility

Identify where loads, capacity headroom, and assets are located

Moves beyond aggregate values and begins to pinpoint constraints.

Predictability

Determine where the next load can be installed

Plan expansion based on the capacity headroom observed at the point where the decision is made

Foresight

Identify when limits are being approached

Take action before operational headroom is compromised

Cost and Efficiency

Reduce manual effort

Fewer spreadsheets, fewer on-site checks, and better utilization of existing capacity

Visibility

Objetivo: Identify where loads, capacity headroom, and assets are located

O que muda na operação: Moves beyond aggregate values and begins to pinpoint constraints.

Objetivo: Determine where the next load can be installed

O que muda na operação: Expansão planejada a partir da margem observada no ponto da decisão.

Objetivo: Identify when limits are being approached

O que muda na operação: Take action before operational headroom is compromised

Objetivo: Reduce manual effort

O que muda na operação: Fewer spreadsheets, fewer on-site checks, and better utilization of existing capacity

When measurements are placed in context, monitoring goes beyond showing the state of the infrastructure and begins to indicate what action to take before a limit is reached.

The ROI of DCIM

What kind of return could this electrical visibility generate for your operations?

Estimate payback, annual return on investment, and the economic potential of integrating DCIM with Intelligent Rack PDUs based on your data center’s characteristics.

How Can I Evaluate My Data Center Power Monitoring Architecture?

Start with the decisions the operations team needs to support and the questions it cannot currently answer with confidence.

Coverage

Which points are monitored, from the facility service entrance to the outlet?

Data Quality

Can the data source, update frequency, unit of measurement, continuous history, and communication failures be identified?

Context

Are measurements linked to locations, assets, limits, capacity, alarms, and operational interventions?

Integration

Are equipment, protocols, drivers, and data models compatible with DCIM? Compatibility must be technically verified, not assumed based solely on marketing materials.

Operational Use

Are there assigned owners, criteria, limits, procedures, and action records for each monitored data point?

If any answer is “I don’t know”, that is the starting point.

From Measurement to Decision

1

1. Measure

Measure

Monitoramento elétrico de data center para medir o consumo de energia da infraestrutura

Current

Voltage

Power

2

2. Locate and Associate

Locate and Associate

Dados elétricos no rack associados aos equipamentos para monitoramento granular de energia

Rack

Phase

Circuit

3

3. Add Context

Add Context

Monitoramento de energia em data center com dados elétricos contextualizados por rack e infraestrutura

Limits

Capacity

Historical Data

4

4. Analyze

Analyze

Consumo elétrico por rack analisado por meio do monitoramento elétrico de data center

Compare behavior

Assess capacity headroom

Identify trends

5

5. Decide and Act

Decide and Act

DCIM e monitoramento elétrico para apoiar decisões e ações na operação do data center

Redistribute loads

Schedule an intervention

Plan expansion

1. Measure

Monitoramento elétrico de data center para medir o consumo de energia da infraestrutura

Current

Voltage

Power

2. Locate and Associate

Dados elétricos no rack associados aos equipamentos para monitoramento granular de energia

Rack

Phase

Circuit

3. Add Context

Monitoramento de energia em data center com dados elétricos contextualizados por rack e infraestrutura

Limits

Capacity

Historical Data

4. Analyze

Consumo elétrico por rack analisado por meio do monitoramento elétrico de data center

Compare behavior

Assess capacity headroom

Identify trends

5. Decide and Act

DCIM e monitoramento elétrico para apoiar decisões e ações na operação do data center

Redistribute loads

Schedule an intervention

Plan expansion

Measurement is the first step, not the last.

The value of monitoring lies in what happens next: knowing where the issue is, understanding its impact, and determining what action to take.

Frequently Asked Questions About Data Center Power Monitoring

It is the continuous tracking of current, voltage, power, and energy at each point in the electrical chain, from the facility service entrance to the outlet, with the data linked to locations, assets, and capacity limits. It supports decisions related to capacity, expansion, and availability.


Because current, power, or energy consumption shows an electrical condition, but not where it occurs, which assets are involved, which limit applies, or how much capacity remains. Without this context, the operations team knows that something has changed but does not know what action to take.

Because the same current reading means different things on a phase with ample headroom and on a phase operating at 93%. Linking the measurement to the rack, phase, circuit, and connected equipment is what turns the number into a diagnosis.

It makes it possible to compare observed capacity with the applicable limit at the exact point where a new load is being considered. This allows the operations team to decide whether to install, redistribute, or expand based on actual headroom, not the site average.

Its role is to measure power where it is consumed. Depending on the model, it provides data by rack, phase, circuit, or outlet, showing how the load is distributed within the rack.

DCIM links each measurement to its location, racks, circuits, assets, capacity limits, and historical data. This allows electrical readings to be interpreted within the context of the infrastructure.

Yes. green4T acts as an integrator of Intelligent Rack PDU and DCIM solutions, covering measurement point assessment, granularity definition, compatibility between equipment and systems, and integration with DCIM.

An aggregate reading shows total power consumption, but not necessarily how the load is distributed across phases. Phase-level measurements help identify load concentrations that may indicate emerging electrical constraints, even when the data center’s total consumption still appears to be within an acceptable range.

A power meter is the device that records electrical measurements at a specific point in the infrastructure, including voltage, current, power, energy consumption, and demand.

Power monitoring uses these measurements within a broader context by linking the data to locations, assets, limits, capacity, and historical information. The meter provides the reading, while monitoring helps interpret what that reading means for data center operations.

Branch Circuit Monitoring (BCM) tracks the load on circuits branching from the electrical distribution system, making it possible to identify how much capacity is being used, where the load is concentrated, and which circuits are approaching their limits.

Before new equipment is connected, these measurements help verify whether the headroom observed at more aggregate levels is also available on the circuit that will supply the new load.

green4T Integrates Intelligent Rack PDUs and DCIM into Data Center Operations

As an integrator of Intelligent Rack PDU and DCIM solutions in Latin America, green4T has more than 9,500 assets monitored through DCIM across its operations.
Its work includes assessing measurement points, defining the required level of granularity, ensuring compatibility between equipment and systems, integrating data with DCIM, and organizing the information that supports decisions related to capacity, growth, and availability.

Assessment

of existing infrastructure, operational needs, and visibility gaps.

Design

of the appropriate metering and data management architecture.

Integration

of Intelligent Rack PDUs, DCIM, and existing systems;

Organization

energy, asset, capacity, environmental, and historical data;

Monitoring

of consumption, capacity headroom, operational risks, and trends.

Evolution

of data center efficiency, visibility, and operational maturity.

An Intelligent Rack PDU measures. DCIM provides context. green4T integrates these layers into data center operations.

Latin America’s leading provider of management and operational services for mission-critical environments

green4T provides continuous support for mission-critical operations across Latin America through local technical presence, standardized processes, and day-to-day operational governance.

500+

managed data centers

60K+

technical service calls per year

8K+

pieces of equipment under management

9.5K+

assets under DCIM monitoring

700+

specialized technicians

70+

cities with an operational presence

4

countries with a structured operational presence

26

Brazilian states and the Federal District

Latin America’s leading provider of management and operational services for mission-critical environments

green4T provides continuous support for mission-critical operations across Latin America through local technical presence, standardized processes, and day-to-day operational governance.

+500

managed data centers

60K+

technical service calls per year

8K+

pieces of equipment under management

9.5K+

assets under DCIM monitoring

+700

specialized technicians

+70

cities with an operational presence

04

countries with a structured operational presence

26

Brazilian states and the Federal District